Basketball, let the data tell |
|
Like all the great sport games that are invented by the human, basketball is full of passion, prides, competition and prevalence. Recently it is just the season of playoffs for all the sports near the summer. Everthing is on the edge of ending for a long period of rest in the summer vocation, as well as the peak of competition for the final running of the triumphs. However, it has been a long time since I looked into the basketball matches. The data driven nature comes up with the idea to understand more about what`s going on in the games. |
|
|
|
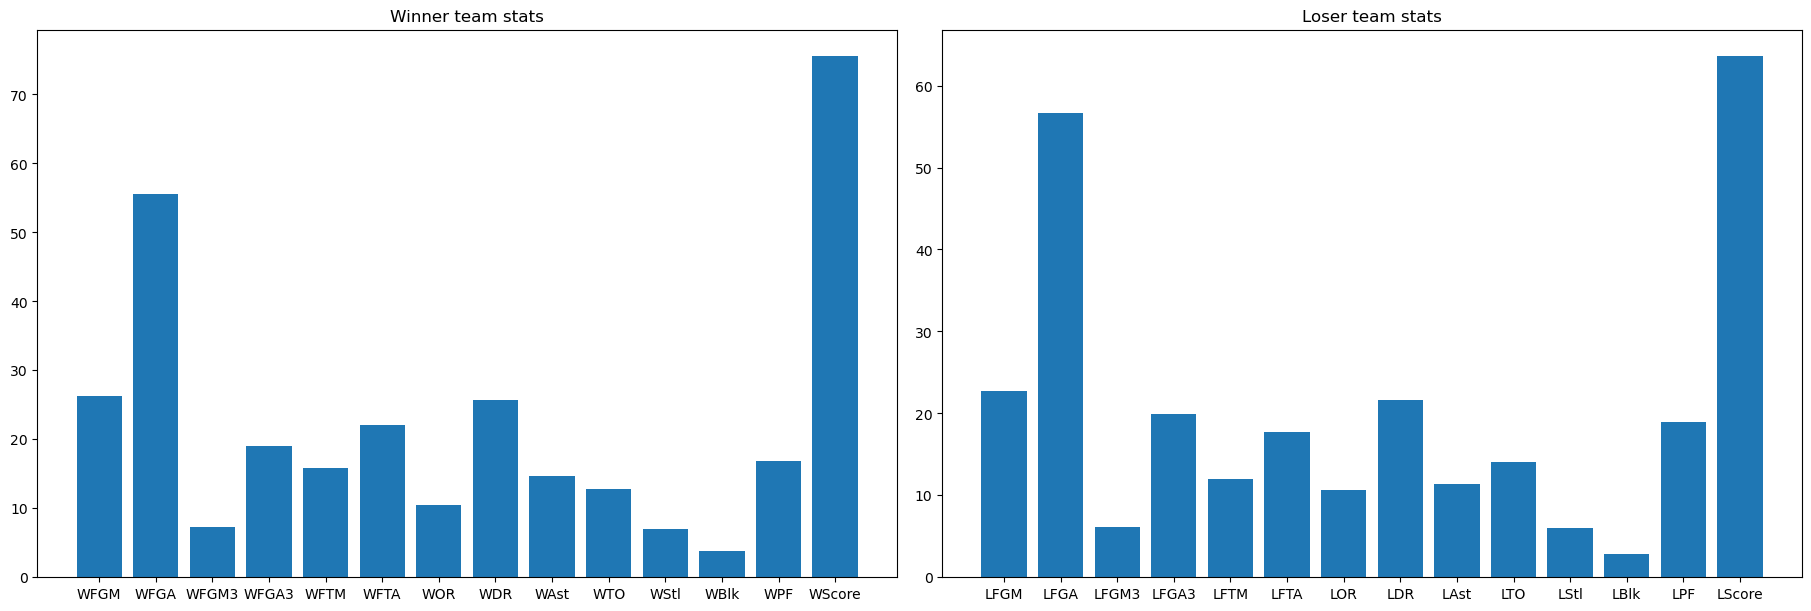
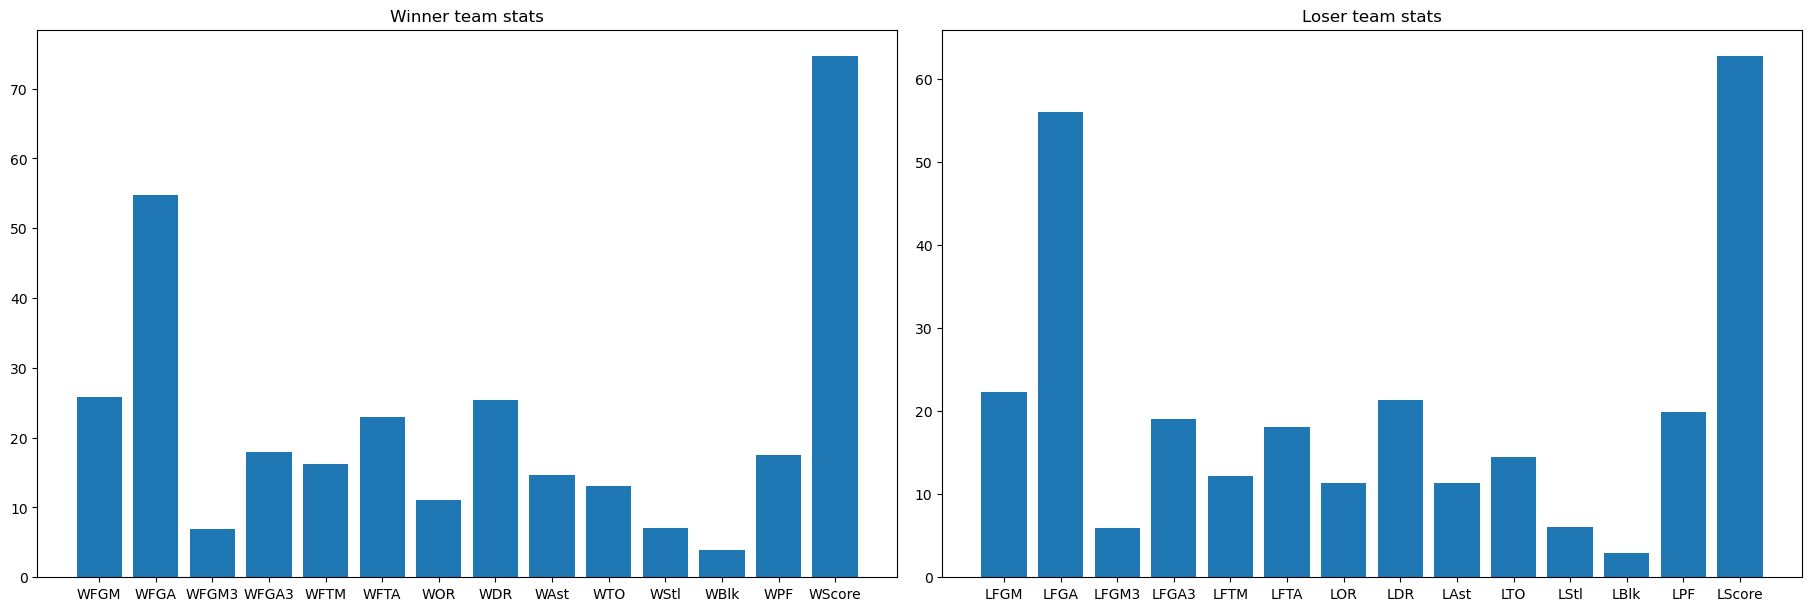
One significant nature of basketball is the precise useage of time to seconds, which strives the statistics of in-match data, like number of field goal attempts, number of rebounds. These data reveals the on-going status of the games and the consequences on final results. On machine learning competition platform Kaggle, there are a series of competitions called "March Machine Learning Mania", which requires to use the data of US colleage basketball tournament (NCAA) for prediction tasks. This series of competitions are quite interesting, as it shows how data science could work in real-world with long term statistic supports. First let`s look at the data that we have about the matches of NCAA. As shown in the above Figure, for each game, along side with winner scores and loser scores, both offensive and defensive data are recorded. As a first tryout, I built a Linear model to predict the scores for each match. |
|
|
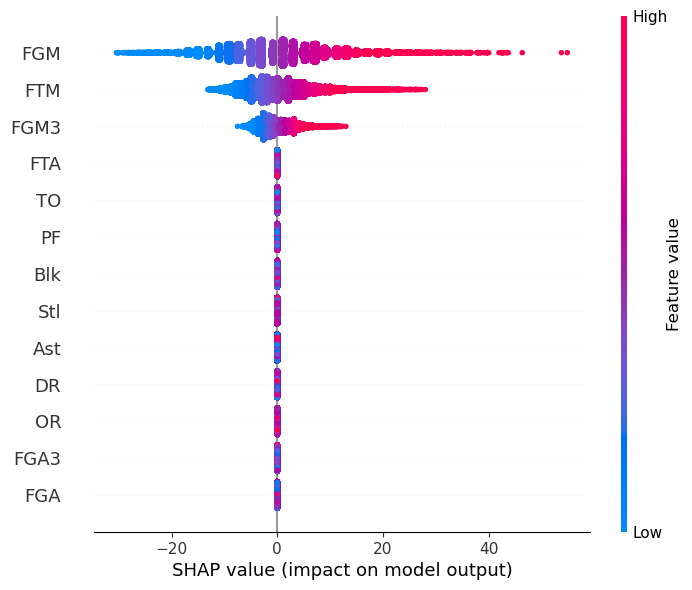
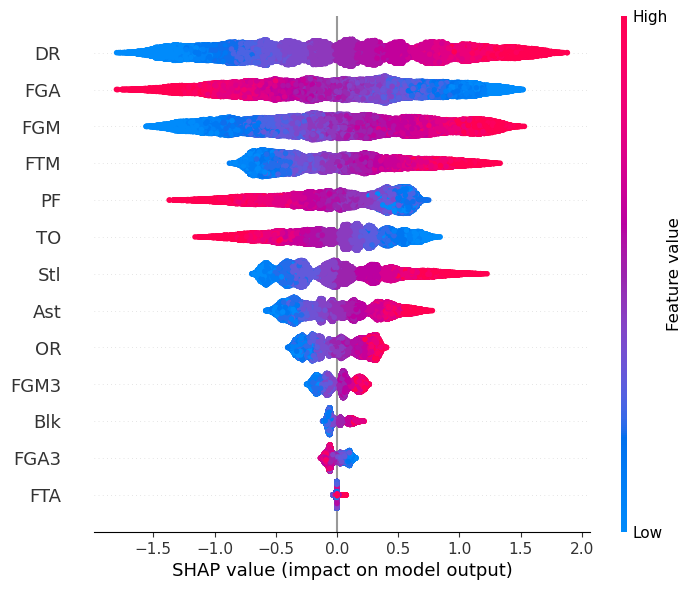
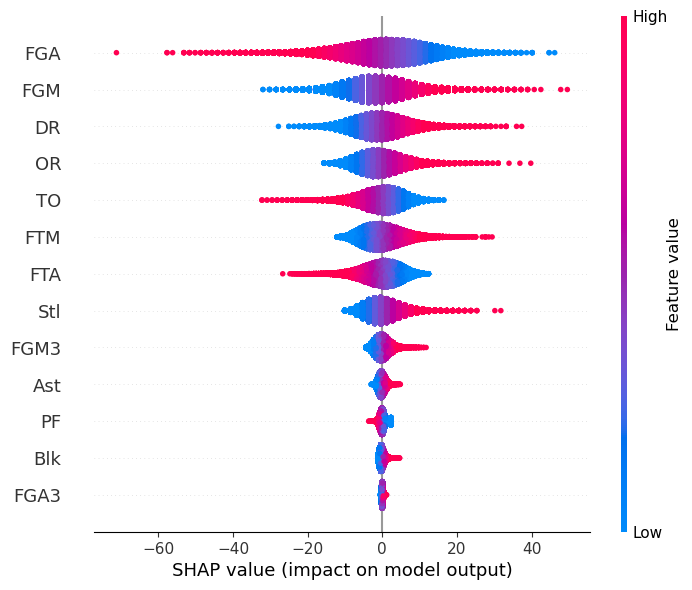
To evaluate the soundness of the regression model that I built, the coefficient of determination measurement is used, where the square error is computed in the measure: \(L = 1 - \frac{u}{v}\), \(u = \sum_{i} (Y_i - \hat{Y}_i)^2\), \(u = \sum_{i} (Y_i - \mu_Y)^2\). The final score for this model on test dataset is reported as \(0.9987\). In the left-above figure, shapley value against each input feature are calculated, where we can see that 'Field Goal Made', 'Free Throw Made', and 'Field Goal 3-Points Made' play as the most important feature for the outcome. While promising, this result does not demonstrate sufficient information to guide the trends of the games, cause it is the common sense that those three index are the composites of the scores. Then I built a model to predict the win or lose of each game with those features. The results show that this model has \(85\) percent accuracy when predicting the matching results on test data. In the right-above figure, shapley value against each feature are demonstrated. Unlike the score prediction, it shows that 'Defense Rebound' has positive effects on the winning of each game, and 'Field Goal Attempt' has negative effects on the winning of each game. This delivers a lot more information than the previous model, as it demonstrates more diverse results about the effects of different statistics on the match results. |
|
|
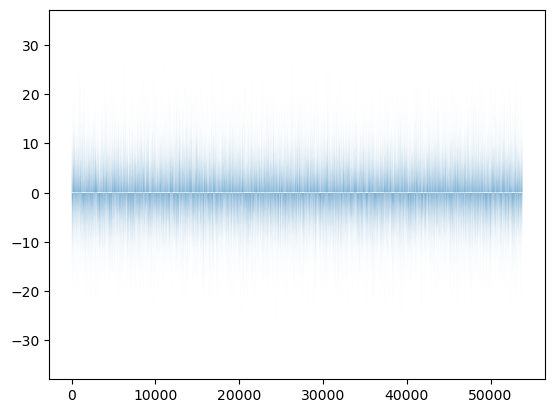
From the results we get so far, as a non-professional basketball coach, with data driven decision making guidance to manage a team, I would be confident to tell my players before each match: 'Sieging the defense rebound! Shooting only when real chances come! And lower unnecessary fouls!' Now it might happen that the team needs more information on how to improve the scores against the opponents, so that the winning rates can be precisely forecasted. Follows this objective, I built another model that predicts the score differences in each match. It achieves the coefficient of determination \(0.7692\), a pretty good result even though it is a bit worse than the previous task. The error modes in right-above figure show that the prediction errors are limited to around 10 points. The shapley value in the left-above figure shows similar results as the win / lose prediction. Now another question comes up, what if the team increases the `Field Goal Attempts' or 'Field Goal 3-points Attempts'? To answer this question, causal inference is required. |
|
|
Answering causal questions require a causal model that allows for querying responses from different causal variable inputs. Here the aim is to discover such causal insights from the historical data, where the causal relations are undermined in the observations. Does `Field Goal 3-points Attempts' affect the 'Field Goal Made' or the other way around? Properly discovering the answer for this question from the historical data could give insightful guidance for the matches. For instance, understanding the how the trends of 3-points tactics become more and more popular in the league. |
|
|
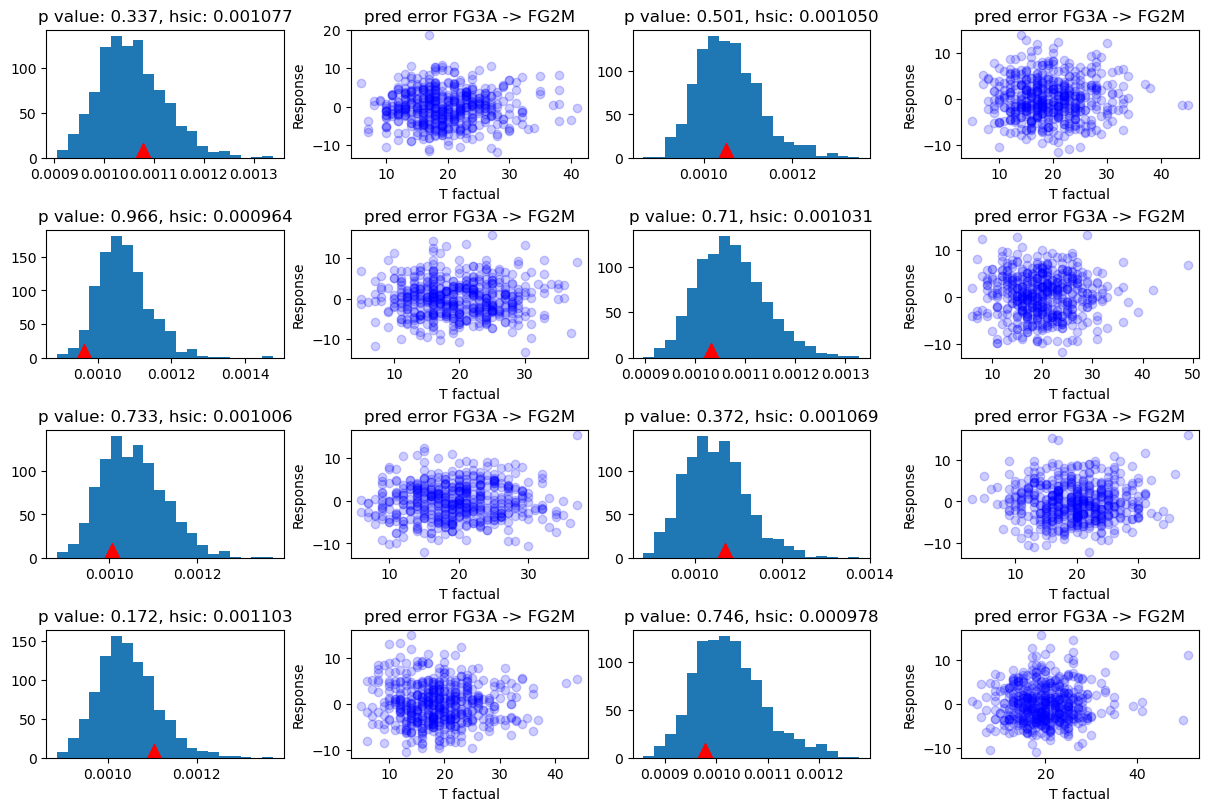
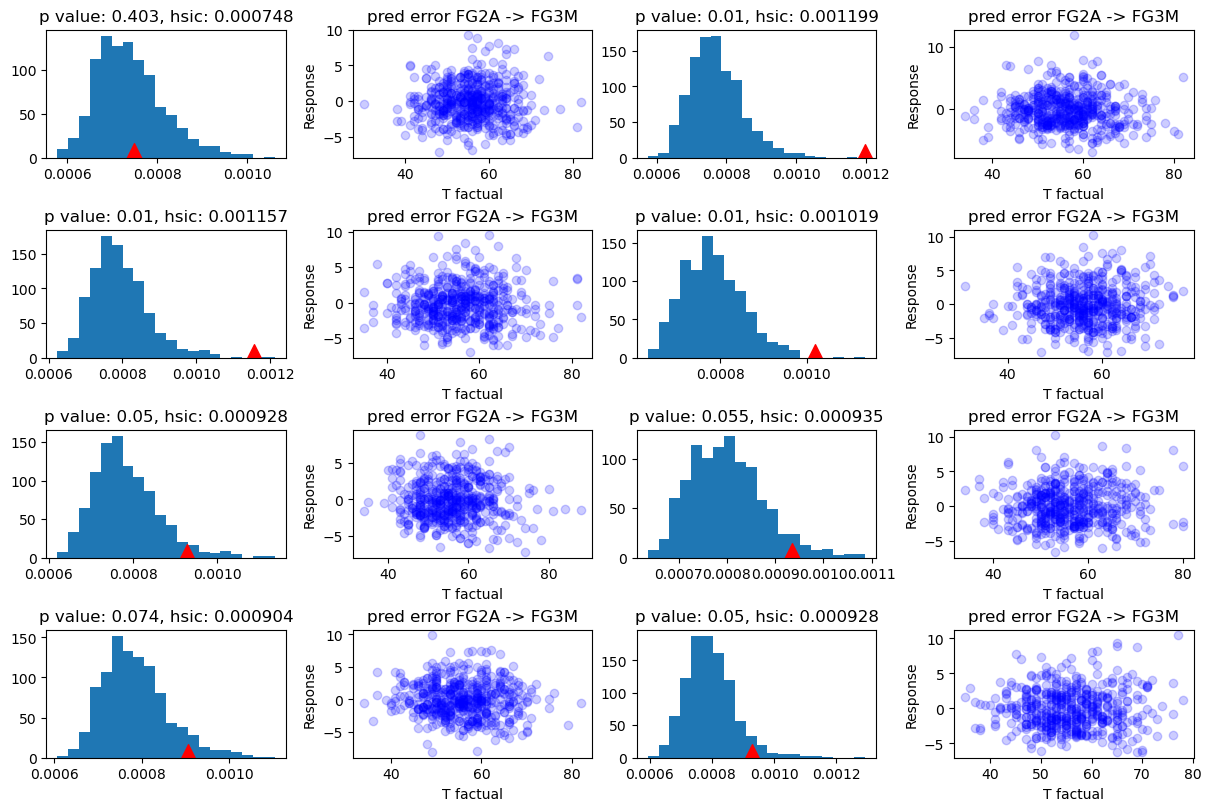
Following this direction I built a regression model between the two variables and conducted statistical tests for both directions. The results from the above two figures show that the independence score falls into the Null distribution in the direction of `FG3A -> FGM' but not `FG2A -> FG3M' in the eight randomly sampled populational groups. Now as a non-professional coach I can be confident in some certain degree to tell my players that 'Let`s make more attempts of 3-point field goals!' Basketball is a great sport game, so is data science, as a great major. However, as all of the other great sports, the most important nature of basketball is the coincidence, where the unknown interventions on the data generating process are always hold by the players on the ground, and determined by the decisions in the milliseconds. This mighted not ever be able to be answered by the data science tools that we currently have. |